
Eve of the Storm? Bitcoin Sees Mysterious ‘Doomsday Cross,’ Tug of War Between Bulls and Bears Unsettled

Original Article Title: "Eve of the Storm? Bitcoin Sees 'Doji' Candlestick, Tug of War Between Bulls and Bears Continues"
Original Source: BitpushNews
In recent days, the market has been in a tug of war, with BTC bulls and bears repeatedly fighting between $100,000 and $96,000. There has been a significant pullback over the past week, with the price briefly dropping below the $91,000 support level. From the volatility, it is evident that investors' anxiety about the short-term trend is escalating.
Hodler Behavior and Market Signals
On February 9, renowned analyst Maartunn shared a set of on-chain data: 14,000 coins of 7 to 10 years of age were moved on-chain.
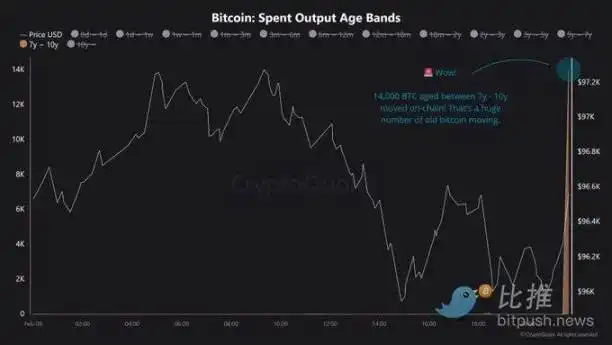
This reactivation of long-held bitcoins back into circulation is usually seen as a significant signal. These movements may indicate various motives—long-term holders preparing for a potential uptrend, institutions readjusting their positions, or market participants being concerned about sustained selling pressure. In any case, the reactivation of such a large amount of old bitcoins usually foreshadows imminent significant price fluctuations. Although such actions are not uncommon during market consolidation periods, they add more uncertainty to the current market sentiment.
Additionally, analyst DOM identified an unprecedented "Doji" candlestick pattern on Bitcoin's daily chart. This pattern typically signifies market uncertainty, similar to the trend following the FTX crash in November 2022.
DOM stated: "For the first time in Bitcoin's 15-year history, we have seen a series of three consecutive 'extreme Doji' candlesticks, with each candle's body accounting for less than 0.05% of the entire candle range. This indicates extreme market indecision, signaling an imminent sharp volatility."
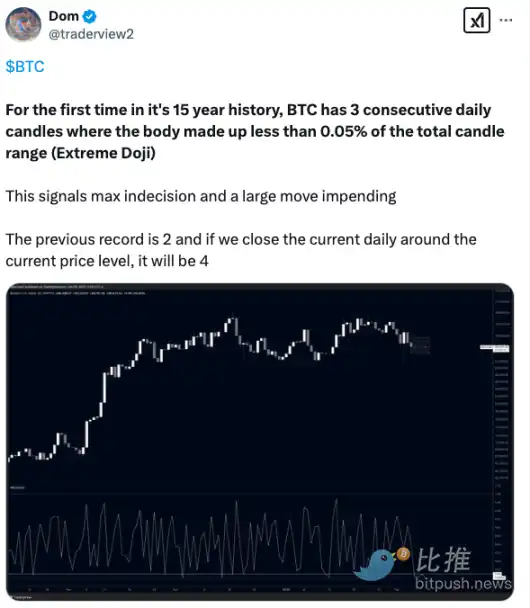
It is worth noting that in November 2022, Bitcoin experienced two consecutive "extreme Doji" candlesticks, followed by a 620% price rebound. If history repeats itself, Bitcoin may be on the verge of another round of explosive price movement.
Key Price Levels and Technical Analysis
TradingView data shows that Bitcoin's current price is hovering around $97,600. Analyst Sebastian believes that to reignite the bullish momentum, Bitcoin first needs to firmly hold the key level of $98,000. This will lay the foundation for breaking through the psychological barrier of $100,000. Once Bitcoin successfully breaks and holds above the $100,000 mark, it will confirm the strong return of bullish momentum and is expected to further explore higher supply ranges, initiating a new uptrend.
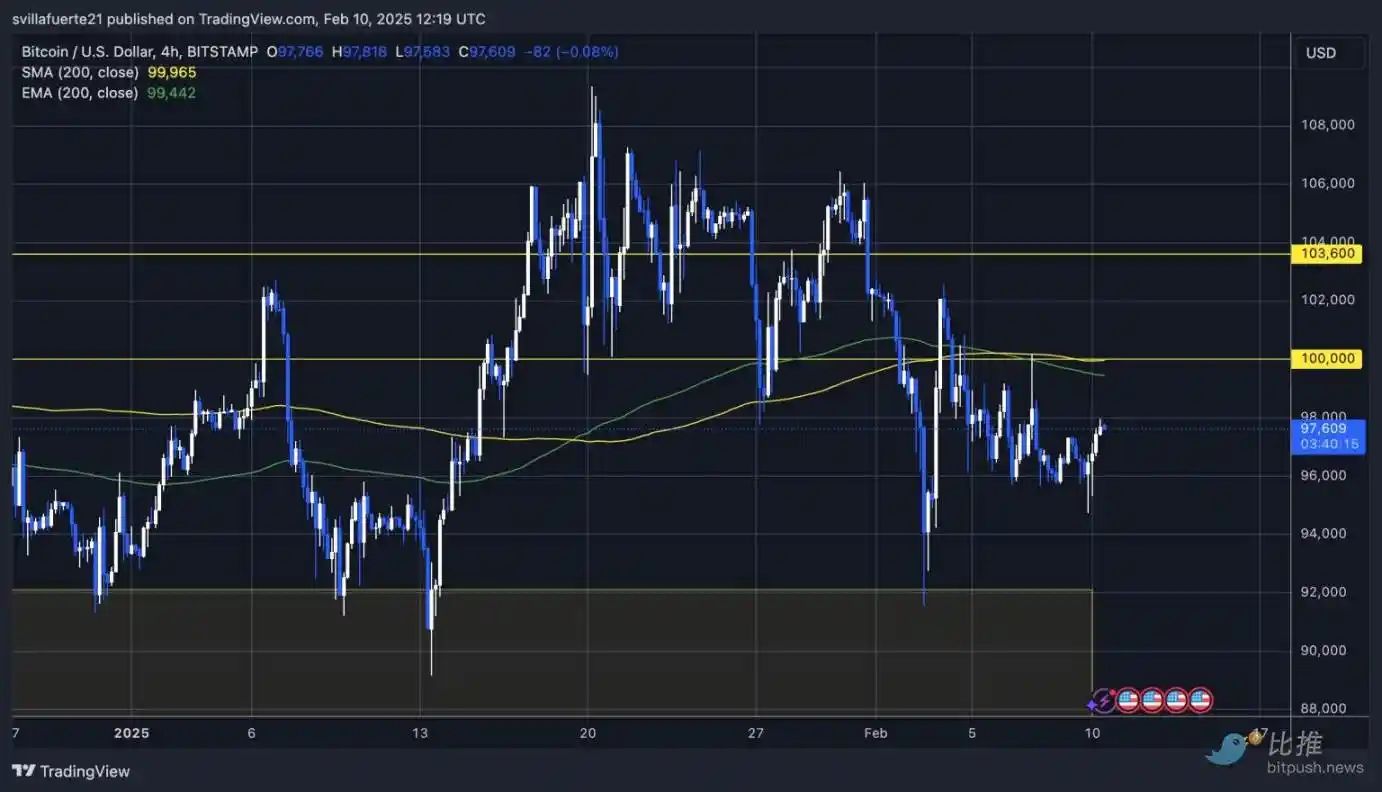
However, the current demand zone between $96,000 and $97,000 must be held to provide support for a potential uptrend. If this range is breached, it could trigger more selling pressure. In this scenario, Bitcoin may drop below $95,000, further down to a demand zone near $90,000. Such a move would significantly impact market sentiment and further strengthen bearish expectations.
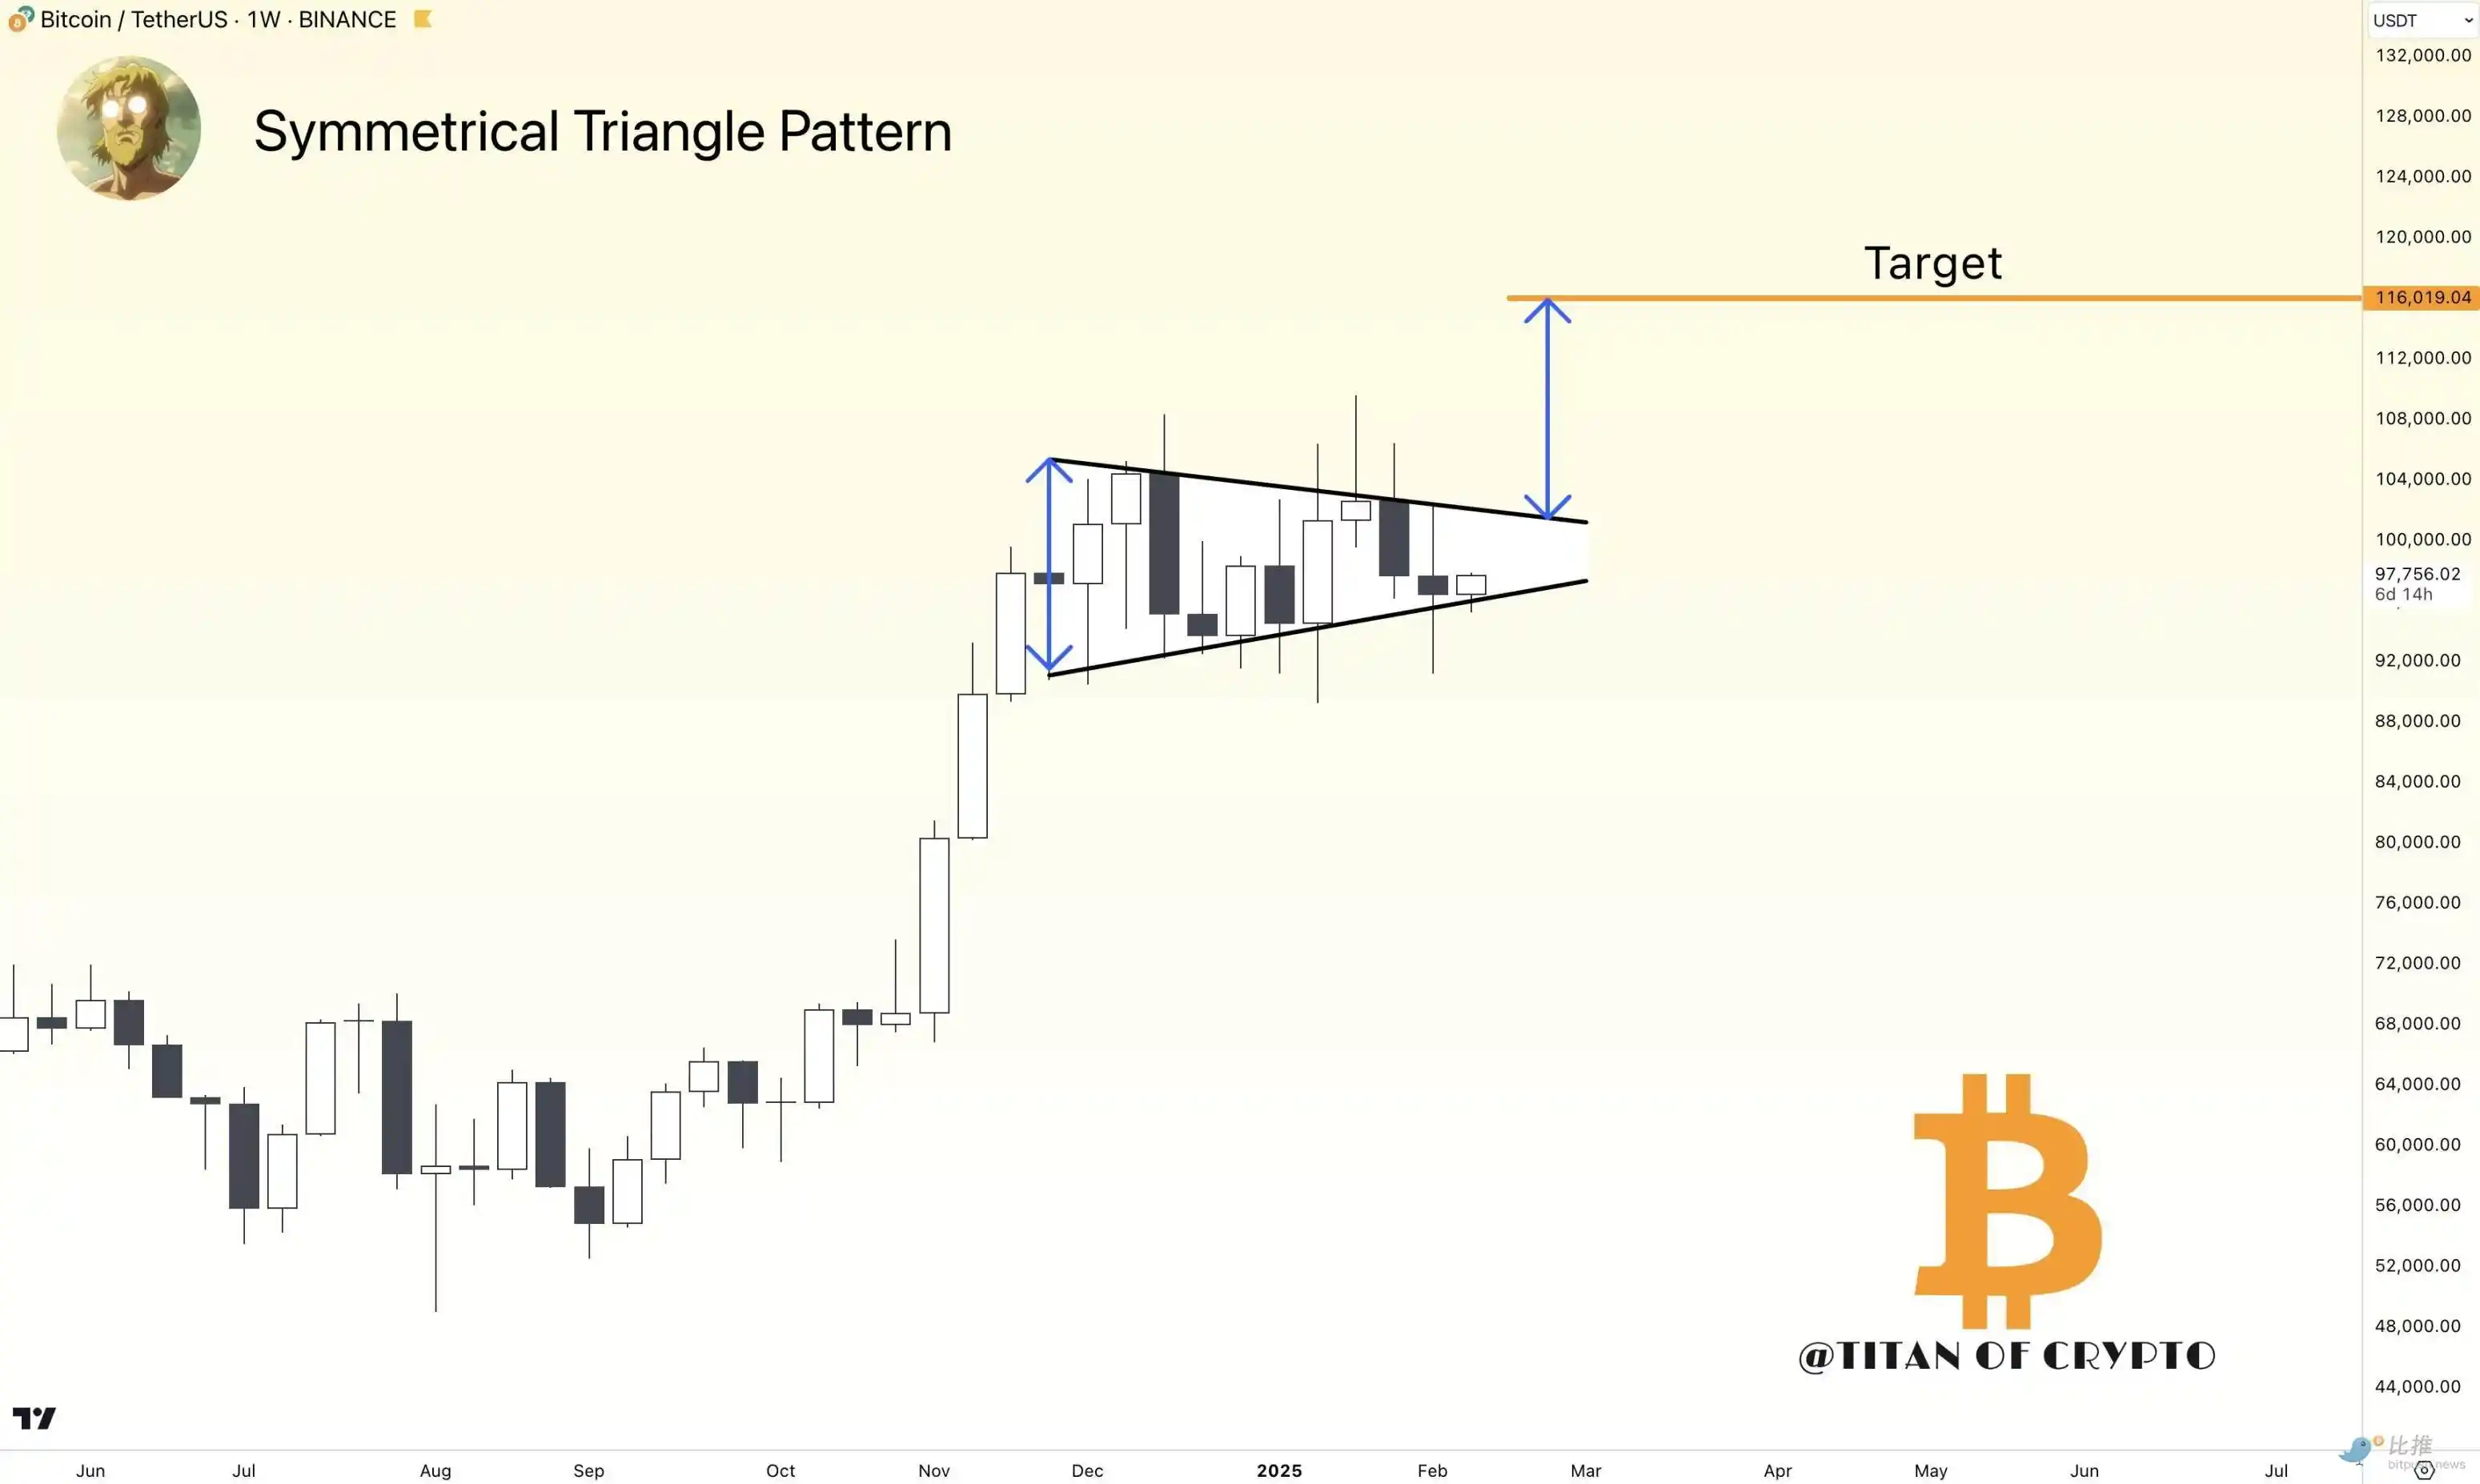
Bitcoin has recently formed a symmetrical triangle pattern, which usually suggests that a price breakout is imminent.
Market analyst Titan of Crypto points out that the Bitcoin price is poised to break above the triangle's upper trendline, eventually reaching a target of $116,000. According to technical analysis rules, the upside target is calculated by adding the maximum distance between the triangle's upper and lower trendlines to the potential breakout point, providing a theoretical basis for Bitcoin's upside target.
Price Outlook
Grayscale's Head of Research, Zach Pandl, predicts that with favorable policies under the Trump administration, Bitcoin could hit a new all-time high in the first quarter of 2025. However, in the short term, $80,000 remains a popular target for many analysts. Investment research firm Bravo Research notes that if the price retreats to this level, it would offer traders a "buy the dip" opportunity.
In conclusion, Bitcoin is currently at a critical technical juncture, where the balance of power between bulls and bears will determine the short-term market direction. Investors need to closely monitor the performance of the key levels at $98,000 and $96,000, as a breakout by either side could trigger significant market volatility.
You may also like

Three years later: Looking back at my judgment of ChatGPT in 2023

From Casino Tools to Global Pricing Machines: The NYSE Leader's Perspective on Hyperliquid

A Detailed Analysis of "Stock God Serenity" Investment Methodology

Sharplink CEO: The future of Ethereum is unfolding
Morning Report | Korea Investment & Securities and OKX plan to jointly acquire 40% of Coinone; Polymarket denies implementing KYC comprehensively; Grayscale delays U.S. stock IPO plans
Bit Digital CEO: Why I Bought More ETH

A Decade of Three Waves of Stock Tokenization from Bitget's Reality: An Unfinished Financial Exploration

"Hu Run Baifu" Dialogue with Sun Yuchen: A New Paradigm of Value Circulation in the Web3 Transformation Cycle

Is it hackers and regulation that ruined DeFi?

Chris Lee: From crypto OG to heavy investments in the three storage giants, predictions on AI bull market corrections, Web4, and opportunities for the younger generation

Ready for a Walk on the Wilder Side of Proof of Talk 2026? Join WEEX Labs in Paris

Gold vs Bitcoin in 2026: Which Market Is Giving Traders Better Opportunities?

Morning News | Coinbase partners with Standard Chartered Bank to expand multi-currency fiat channels; Sharplink and Forward will be included in the Russell Index; JPMorgan may issue stablecoins in the future

Hash Global Founder: Why I Also Chose to Liquidate All My ETH?

Tokenized US Stock Duel: Ondo vs. xStocks, Who is Defining On-Chain Nasdaq?

He Yideng ranked: Since you're here, you might as well
The era of regulatory arbitrage has come to an end, and the value of cryptocurrency exchange licenses is being fiercely contested
Six Major Complaints from an Ethereum Developer
Three years later: Looking back at my judgment of ChatGPT in 2023
From Casino Tools to Global Pricing Machines: The NYSE Leader's Perspective on Hyperliquid
A Detailed Analysis of "Stock God Serenity" Investment Methodology
Sharplink CEO: The future of Ethereum is unfolding
Morning Report | Korea Investment & Securities and OKX plan to jointly acquire 40% of Coinone; Polymarket denies implementing KYC comprehensively; Grayscale delays U.S. stock IPO plans
Bit Digital CEO: Why I Bought More ETH


